20 个优秀的数据可视化工具
Modest Maps
Modest Maps is a small, extensible, and free library for designers and developers who want to use interactive maps in their own projects. It provides a core set of features in a tight, clean package with plenty of hooks for additional functionality.

Chartkick
Create beautiful Javascript charts with one line of Ruby. No more fighting with charting libraries!

Bonsai
A lightweight graphics library with an intuitive graphics API and an SVG renderer.

Dygraphs
Dygraphs is a fast, flexible open source JavaScript charting library.

Smoothiecharts
A JavaScript Charting Library for Streaming Data.

Envisionjs
HumbleFinance is a HTML5 and Canvas finance visualization tool written in JavaScript.

Visualize Free
Visualize Free is a free visual analysis tool based on the advanced commercial dashboard and visualization software developed by InetSoft, an innovator in business intelligence software since 1996.

TimeFlow
Time Flow is an open-source timeline built to help journalists analyze temporal data. The application offers several view modes–timelime, calendar, list, table–to help explore thousands of data points.

D3js
D3.js is a JavaScript library for manipulating documents based on data. D3 helps you bring data to life using HTML, SVG and CSS.

JavaScript InfoVis Toolkit
The JavaScript InfoVis Toolkit provides tools for creating Interactive Data Visualizations for the Web.

Paperjs
Paper.js is an open source vector graphics scripting framework that runs on top of the HTML5 Canvas.

jpGraph
JpGraph is an Object-Oriented Graph creating library for PHP >= 5.1 The library is completely written in PHP and ready to be used in any PHP scripts (both CGI/APXS/CLI versions of PHP are supported).

Crossfilter
Crossfilter is a JavaScript library for exploring large multivariate datasets in the browser.

OpenLayers
OpenLayers makes it easy to put a dynamic map in any web page. It can display map tiles and markers loaded from any source.

Raphaeljs
Raphaël is a small JavaScript library that should simplify your work with vector graphics on the web.

Flot Charts
Flot is a pure JavaScript plotting library for jQuery, with a focus on simple usage, attractive looks and interactive features.

Pizza Pie Charts
Creating responsive pie charts for any device is a piece of pie.

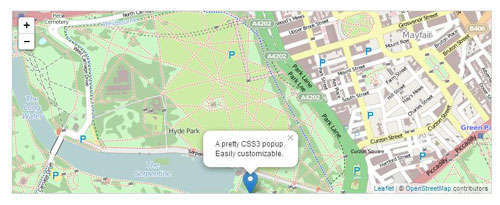
Leafletjs
Leaflet is a modern open-source JavaScript library for mobile-friendly interactive maps. It is developed by Vladimir Agafonkin with a team of dedicated contributors.
Polymaps
Polymaps is a free JavaScript library for making dynamic, interactive maps in modern web browsers.

Google Charts
Google chart tools are powerful, simple to use, and free. Try out our rich gallery of interactive charts and data tools.
