用于创建交互地图的最好JavaScript库
1. Heatmap.js

Heatmap.js makes dynamic heatmaps for the web. This JavaScript library will help you make your 3 dimensional data speak up. Use heatmap.js v2.0 to add new value to your project, build a business based on it, study and visualize user behaviour, and much more. Heatmap.js v2.0 is the most advanced heatmap visualization library on the web. It has a light footprint (~3kB gzip) and with the new 2.0 release heatmap.js just got faster, with a new rendering module stronger, to handle even more datapoints (40k+), easier to use so you can get up to speed quickly easier to extend for custom functionality.
2. GMaps
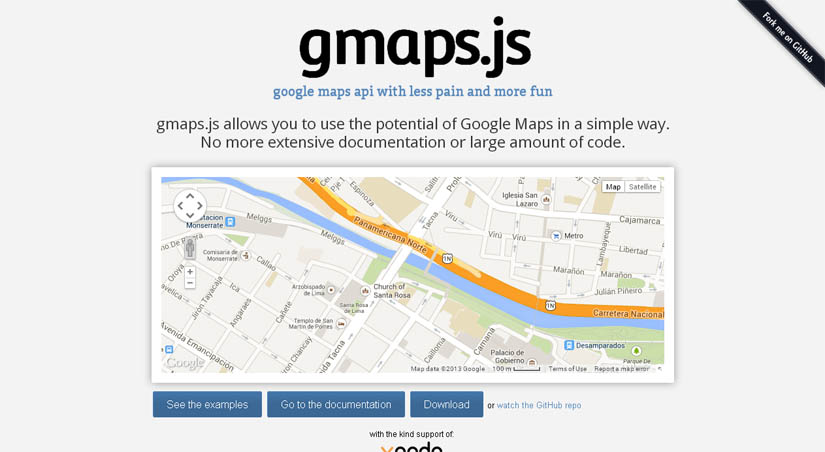
GMaps.js allows you to use the potential of Google Maps in a simple way. No more extensive documentation or large amount of code. GMaps is compatible with JSON formatted data which you can utilize to integrate your map with a particular app, like Foursquare.
3. jHere

With jHERE, you can easily add interactive maps to your website. In only 4KB, you get a powerful map API, highly customizable markers, event handling and info bubbles. Bonus features are KML support and data visualization via heatmaps.
4. Cesium

Cesium, a WebGL-powered JavaScript mapping library, offers just that by being provider-agnostic. It has support for 3 different views: 3D globe, 2D map, and 2.5D Columbus View where transitioning from one to another is just a line of code. Drawing any type of shapes, highlighting specific regions and interacting with the map using mouse or touch is pretty easy. Cesium comes as a single JS file and work in all major browsers including mobile.
5. Kartograph

Kartograph is a framework for creating interactive maps without any mapping provider (like Google Maps). If you already have the SVG data (for ex: any drawing can be converted to SVG with Adobe Illustrator), only the JavaScript library can help too. The JS library uses jQuery + Raphaël, outputs can be styled with CSS and a very good documentation is provided.
6. D3.js

D3.js is a JavaScript library for manipulating documents based on data. D3 helps you bring data to life using HTML, SVG and CSS. D3’s emphasis on web standards gives you the full capabilities of modern browsers without tying yourself to a proprietary framework, combining powerful visualization components and a data-driven approach to DOM manipulation.
7. DataMaps

DataMaps is a script to display any data interactively and beautifully inside maps. It comes with ready-to-use maps for world map with countries, USA with states and a combined one. The map data is stored as JSON and any custom maps can be created by following the structure. DataMaps makes use of D3, Backbone + Underscore and comes as a jQuery plugin (or a as a standalone Backbone view).
8. Stately

Stately is JavaScript library that is developed to generate US maps. The library is comparably lightweight considering that you can add interactive elements on top of your generated maps.
9. OSM Buildings

OSM Buildings is a JavaScript library that enables us to create a similar functionality using any mapping provider. The library uses Leaflet mapping engine and HTML5 canvas (rather than WebGL) and requires the geometry data of the area to be visualized. There are various free sources for such data and the library can be handy when creating such custom visualizations for a limited area.
10. Leaflet

Leaflet is a modern open-source JavaScript library for mobile-friendly interactive maps. Leaflet is designed with simplicity, performance and usability in mind. It works efficiently across all major desktop and mobile platforms out of the box, taking advantage of HTML5 and CSS3 on modern browsers while still being accessible on older ones. It can be extended with many plugins, has a easy to use and well-documented API and a simple, readable source code.
11. PolyMaps

Polymaps is a free JavaScript library for creating dynamic and interactive maps. Besides the usual cartography from OpenStreetMap, CloudMade, Bing, etc., itworks with image-based and vector-tiled maps by providing a quick display of multi-zoom datasets over maps, and supports a variety of visual presentations. As Polymaps can load data at a full range of scales, it’s a good fit for showing information from country level on down to states, cities, neighborhoods, and individual streets.
12. Cartographer.JS

Cartographer is a JavaScript library for creating thematic maps on Google Maps which supports custom styling. It is only a one JavaScript file that relies on the powerful Raphael.js vector-graphics library. The areas on maps are mentioned as latitudes or regions (depending on the type) which mean no hacking or manual calculations. Every visualization type comes with different options like colors, opacity, stroke & more.
13. MaPlace.js

Maplace.js is a small Google Maps Javascript plugin for jQuery that helps you to embed Google Maps into your website, quickly create markers and controls menu for the locations on map. It requires jQuery and Google Maps API v3 so you need to have both in your page.It supports markers and custom icons, zoom level and custom controls menu. It is released under the MIT license.
14. amMap

amMap is a tool that you can use to easily add interactive map functionality to your web pages and JavaScript-based applications. You can use this tool to show locations of your offices, routes of your journeys, create your distributor map, etc. Photos or illustrations can be used as layers and backgrounds of maps, so you can make different presentations, e-learning tools and more.
15. SpryMap

SpryMap is a super lightweight (2.8 KB), dependency free Javascript widget that turns any HTML element into a Google Maps-like click and drag window. SpryMap is released under the creative commons license, essentially you’re free to use it and adapt it for any personal or commercial purposes.