Generate interactive 3d plots with a simple function call. Function returns a Three.js scene which can be customized as needed.
Basic function call generates a X-Y-Z scatter plot. Optional configuration object can be used to change color and size values.
bower install z3d
Why use Z3d? Because configuration is optional, an interactive 3d plot with sensible defaults can be generated with as little as a single line.
Plotting function takes the data to plot and an optional configuration object.
###Basic Example (no configuration)
<html>
<head>
<script src="bower_components/threejs/build/three.min.js" charset="utf-8"></script>
<script src="bower_components/z3d/js/OrbitControls.js" charset="utf-8"></script>
<script src="bower_components/z3d/js/plot.js" charset="utf-8"></script>
</head>
<body>
<script type="text/javascript">
//HERE IS THE DATA TO PLOT:
var x = [-0.8234, 0.0952, 1.9594, -0.2831, -0.4147, 1.5859, 0.5326, 0.0925, 0.3293, 1.3635, 0.3396, 0.0677, -0.6739, 0.4084, -1.4487, -0.1101, -0.7521, -1.2118, 1.7191, 0.2020, -0.1573, -0.2298, -0.8230, 1.7924, 0.4511];
var y = [-1.4166, 1.353, -0.6294, 0.0567, 1.4157, 0.32806, 0.2377, -0.2262, -1.0602, -1.8150, 0.1075, -1.3516, 1.0137, 0.0183, -0.5466, 0.6416, -0.6655, 0.6874, -0.4616, -0.2808, 1.3443, -1.0518, -0.1332, -1.0097, 0.3643];
var z = [1.4166, -1.353, 0.6294, -0.0567, -1.4157, -0.32806, -0.2377, 0.2262, 1.0602, -1.5089, 0.1543, -0.3516, 0.0137, 1.0183, 1.5466, -1.6416, 1.6655, -1.6874, -0.4616, -1.2808, -1.3443, 1.0518, -0.1332, 1.9700, -0.3643];
//AND THIS IS HOW WE PLOT IT:
var plot = plot3d(x,y,z);
</script>
</body>
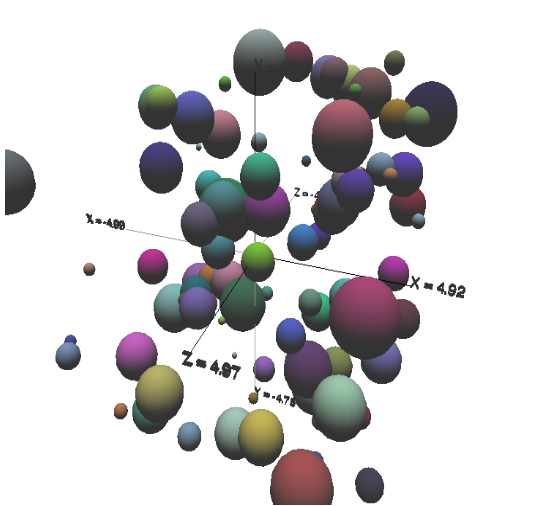
</html>###Example With Configuration
We can add a configuration object to the example above to modify the height/width of our plot, the DOM element the visualization is appended to, the labels on the points plotted, the size of the points plotted, and the color of the points plotted.
<html>
  <head>
    <script src="bower_components/threejs/build/three.min.js" charset="utf-8"></script>
    <script src="bower_components/z3d/js/OrbitControls.js" charset="utf-8"></script>
    <script src="bower_components/z3d/js/plot.js" charset="utf-8"></script>
  </head>
  <body>
    <div id='myDOMel'></div>
    <script type="text/javascript">

      //HERE IS THE DATA TO PLOT:
      var x = [-0.8234, 0.0952, 1.9594, -0.2831, -0.4147, 1.5859, 0.5326, 0.0925, 0.3293, 1.3635, 0.3396, 0.0677, -0.6739, 0.4084, -1.4487, -0.1101, -0.7521, -1.2118, 1.7191, 0.2020, -0.1573, -0.2298, -0.8230, 1.7924, 0.4511];
      var y = [-1.4166, 1.353, -0.6294, 0.0567, 1.4157, 0.32806, 0.2377, -0.2262, -1.0602, -1.8150, 0.1075, -1.3516, 1.0137, 0.0183, -0.5466, 0.6416, -0.6655, 0.6874, -0.4616, -0.2808, 1.3443, -1.0518, -0.1332, -1.0097, 0.3643];
      var z = [1.4166, -1.353, 0.6294, -0.0567, -1.4157, -0.32806, -0.2377, 0.2262, 1.0602, -1.5089, 0.1543, -0.3516, 0.0137, 1.0183, 1.5466, -1.6416, 1.6655, -1.6874, -0.4616, -1.2808, -1.3443, 1.0518, -0.1332, 1.9700, -0.3643];

      var labs = [];
      z.forEach(function(el,i){
        labs.push('label '+i);
      });

      //make a function to generate random colors for the points in our example
      function getHexColor(){
        var chars = ['1','2','3','4','5','6','7','8','9','a','b','c','d','e','f'];
        var string = '';
        for (var i=0;i<6;i++){
          var index = Math.floor(Math.random()*16);
          string += chars[index];
        }
        return string;
      }

      //now we generate size and color arrays for our points
      var sizes = [];
      var colors = [];
      for (var i=0; i<x.length; i++){
        sizes.push(Math.random());
        colors.push(getHexColor());
      }

      //THIS IS WHERE WE MAKE THE CONFIGURATION OBJECT:
      var config = {
        size: sizes,
        color: colors,
        label: labs,
        //height and width of the DOM element
        height: 400,
        width: 400,
        elementID: 'myDOMel'
      }

      //AND THIS IS HOW WE PLOT IT:
      var plot = plot3d(x,y,z,config);

    </script>
  </body>

</html>The MIT License (MIT)
Copyright (c) 2014 Nathan Epstein
Permission is hereby granted, free of charge, to any person obtaining a copy of this software and associated documentation files (the "Software"), to deal in the Software without restriction, including without limitation the rights to use, copy, modify, merge, publish, distribute, sublicense, and/or sell copies of the Software, and to permit persons to whom the Software is furnished to do so, subject to the following conditions:
The above copyright notice and this permission notice shall be included in all copies or substantial portions of the Software.
THE SOFTWARE IS PROVIDED "AS IS", WITHOUT WARRANTY OF ANY KIND, EXPRESS OR IMPLIED, INCLUDING BUT NOT LIMITED TO THE WARRANTIES OF MERCHANTABILITY, FITNESS FOR A PARTICULAR PURPOSE AND NONINFRINGEMENT. IN NO EVENT SHALL THE AUTHORS OR COPYRIGHT HOLDERS BE LIABLE FOR ANY CLAIM, DAMAGES OR OTHER LIABILITY, WHETHER IN AN ACTION OF CONTRACT, TORT OR OTHERWISE, ARISING FROM, OUT OF OR IN CONNECTION WITH THE SOFTWARE OR THE USE OR OTHER DEALINGS IN THE SOFTWARE.