I’ve used printf debugging since forever and I always seem to solve my bugs faster that way.
Some cases calls for better tools so here are some gems that I’m sure you’ll find useful:
1. debugger;
As I’ve mentioned before, you can use the “debugger;” statement to force a breakpoint in your code.
Need a conditional breakpoint? Just wrap it with an IF clause:
if (somethingHappens) {
debugger;
}
Just remember to remove these before going live.
2. Break on node changes
Sometimes the DOM just gets a mind of its own. Weird changes take place and it’s hard to get to the source of the problem.
The Chrome Developer Tools has one super useful trick for debugging this. It’s called “Break on…” and you can find it by right clicking a DOM node on the elements tab.
Breakpoints can be set when the node is removed, the node’s attributes change or one of its subtree nodes changes.

3. Ajax breakpoints
XHR Breakpoints, or Ajax breakpoints as I call them, allow to break when a desired Ajax call is made.
This is an amazing tool when debugging your web app’s networking.

4. Emulate different mobile devices
Chrome added interesting mobile emulation tools that will make your life much easier.
Find them by choosing any tab that isn’t the Console tab, press esc key on your keyboard and choose the device you wish to emulate.
You won’t get a real iPhone, but the dimensions, touch events and user agent will be emulated for you.

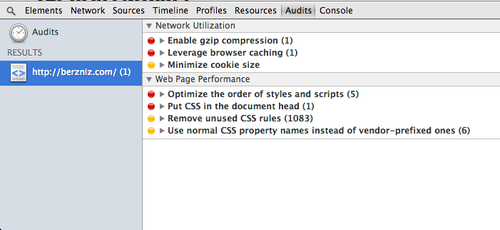
5. Improve your site with Audits
YSlow is a great tool. Chrome also includes a similar tool under the developer tools called Audits.
Take a quick audit of your site and get useful and practical tips for optimizing it.
What else?
I can’t imagine developing without these tools. I’ll post more tricks as I find them, so stay tuned.
Find me on twitter: @ketacode