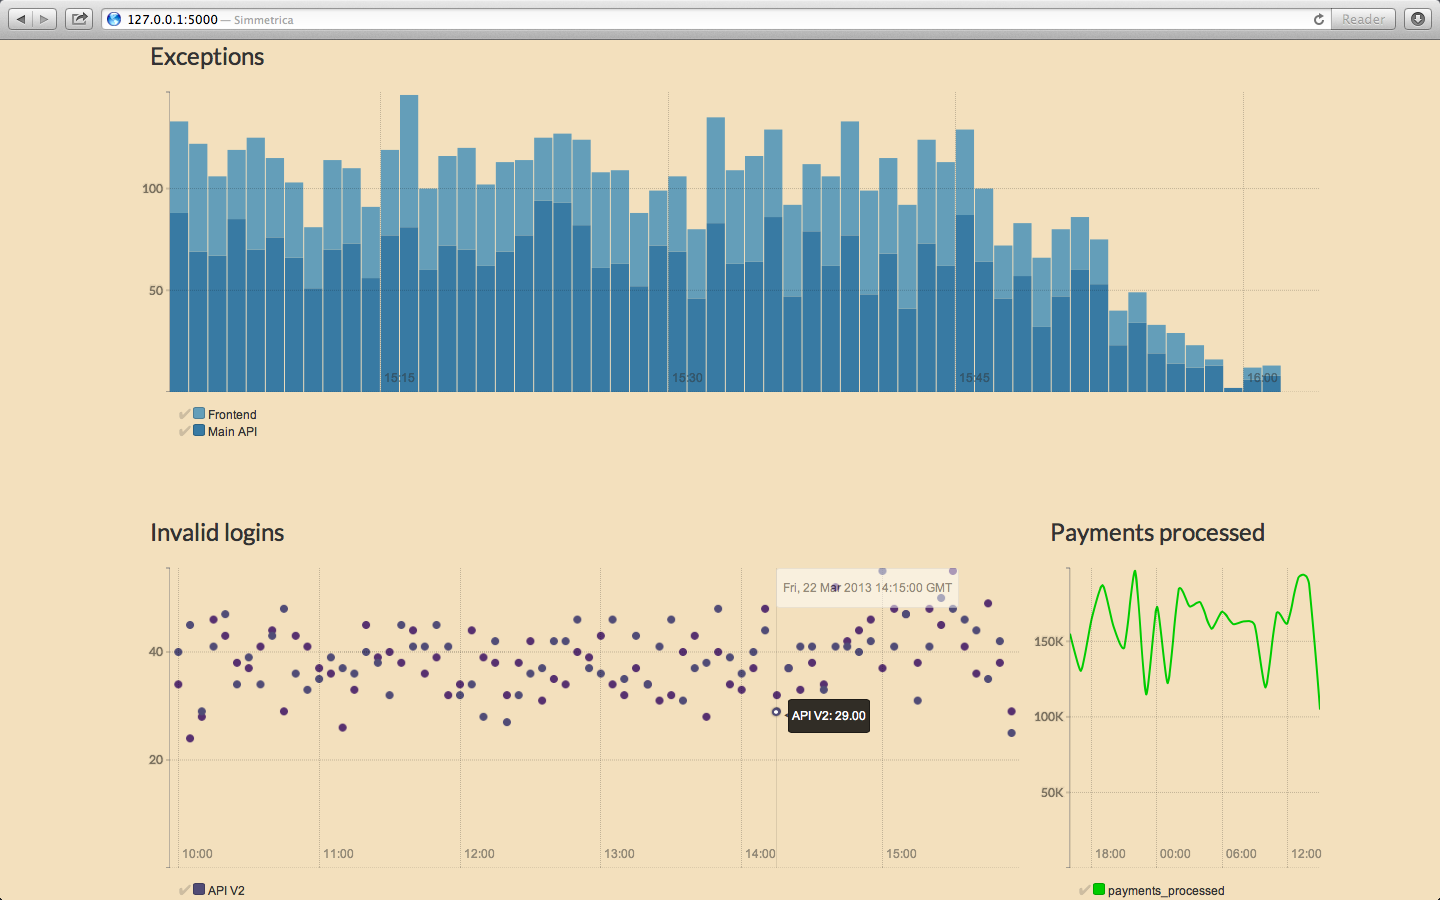
Simmetrica is a lightweight framework for collecting and aggregating event metrics as timeseries data. It also comes with beautiful customizable dashboard for visualizing metrics with charts.
- Python 2.6 or greater
- Redis Server
Most of the current Linux distributions (also Mac OS X) comes with Python installed default. Simmetrica also uses redis for storing data, you can install redis-server with your favorite package manager.
➜ [sudo] pip install simmetrica
You need to run redis-server before pushing events and querying stored data.
We will use push method for notifying our events, it has 3 parameters:
First parameter is event, which is canonical name of your input data. You'll use this name when querying data and configuring dashboard. Second is increment, this optional argument is useful for overriding event count for submitting multiple events in a single operation. Last parameter now is defaults to current Unix timestamp, lets you to specify when event occurs.
To aggreagate stored data, we will use query method, it has 4 parameters:
First one is event, as you guessed, we already used this value for feeding our data. start and end parameters take Unix timestamp for specifying interval of time-series. This parameters are mandatory. Last parameter resolution is used for defining the resolution / granularity of data. This is an optional parameter and it defaults to 5min (five minutes). Possible values are min, 5min, 15min, hour, day, week, month and year.
>>> from simmetrica import Simmetrica
>>> simmetrica = Simmetrica()
>>> simmetrica.push('add-cart-action')
[1L, 1L, 1L, 1L, 1L, 1L, 1L, 1L]
Overriding default parameters:
>>> simmetrica.push('nginx-connections-received-5min', increment=5, now=1364298120)
>>> start = simmetrica.get_current_timestamp() - 600
>>> end = simmetrica.get_current_timestamp()
>>> results = simmetrica.query('add-cart-action', start, end, 'min')
>>> for time, val in results:
...     print time, val
...
1364297940 0
1364298000 0
1364298060 0
1364298120 0
1364298180 0
1364298240 0
1364298300 0
1364298360 0
1364298420 0
1364298480 1
1364298540 2
➜ simmetrica-cli.py push add-cart-action
ok
Overriding default parameters:
➜ simmetrica-cli.py push nginx-connections-received-5min --increment=5 --now=1364298120
➜ simmetrica-cli.py query add-cart-action 1364297990 1364298608 --resolution=min
1364297940 0
1364298000 0
1364298060 0
1364298120 0
1364298180 0
1364298240 0
1364298300 0
1364298360 0
1364298420 0
1364298480 1
1364298540 2
Beautify with spark
➜ python cli.py query add-cart-action 1364297990 1364298608 --resolution=min | awk '{print $2}' | spark
▁▁▁▁▁▁▁▁▁▄█
After running simmetrica-app.py
➜ curl 127.0.0.1:5000/push/add-cart-action
ok
Overriding default parameters:
➜ curl 127.0.0.1:5000/push/nginx-connections-received-5min?increment=5&now=1364298120
➜ curl "127.0.0.1:5000/query/add-cart-action/1364297990/1364298608?resolution=min" | python -mjson.tool
{
    "1364297940": 0,
    "1364298000": 0,
    "1364298060": 0,
    "1364298120": 0,
    "1364298180": 0,
    "1364298240": 0,
    "1364298300": 0,
    "1364298360": 0,
    "1364298420": 0,
    "1364298480": "1",
    "1364298540": "2"
}
As default Simmetrica connects to Redis on 127.0.0.1:6379 with database 0.
>>> from simmetrica import Simmetrica
>>> simmetrica = Simmetrica(host='192.168.5.30', port=7000, db=16, password=qwerty)
redis_host, redis_port, redis_db and redis_password parameters can be passed as commandline arguments in simmetrica-app.py and simmetrica-cli.py.
➜ simmetrica-cli.py ... --redis_host=192.168.5.30 --redis_port=7000 --redis_db=16 --redis_password=qwerty
➜ simmetrica-app.py
 * Running on http://127.0.0.1:5000/
Now, you can see your shiny dashboard with pointing your browser to http://127.0.0.1:5000/.
Optionally a custom config file can be specified with the --config flag.
➜ simmetrica-app.py --config myConfig.yml
Dashboard is configured with /opt/simmetrica/config/config.yml file, this file has a yaml list called graphs. Graph widgets are rendered with lovely rickshaw (HTML5 + SVG and d3.js) library.
graphs:
    - graph definition
        - events
    - graph definition
        - events
Typical graph block looks like this:
- title: Title (mandatory)
  timespan: [10 minute, 3 hour, 2 day, 6 week, 1 month or whatever]
  colorscheme: [classic9, colorwheel, cool, munin, spectrum14, spectrum2000, spectrum2001]
  type: [area, stack, bar, line, scatterplot]
  interpolation: [linear, step-after, cardinal, basis]
  resolution: [min, 5min, 15min, hour, day, week, month, year]
  size: [S, M, L, XL]
  offset: [zero, wiggle, expand, value]
  events:
      - name: event_name (mandatory)
        title: Event Title
Here are the explanations:
title
Title of graph block.
Optional: No
timespan
How many timespan of data will shown in graph.
Possible values: (NUMBER minute|hour|day|week|month|year)
Optional: Yes
Default: 1 day
colorscheme
Colorscheme of graph parts.
Possible values: classic9, colorwheel, cool, munin, spectrum14, spectrum2000 and spectrum2001
Optional: Yes
Default: colorwheel
type
Type of graph.
Possible values: area, stack, bar, line and scatterplot
Optional: Yes
Default: area
interpolation
Line smoothing / interpolation method of graphs.
Possible values: linear, step-after, cardinal and basis
Optional: Yes
Default: cardinal
resolution
Resolution of values.
Possible values: min, 5min, 15min, hour, day, week, month, year
Optional: Yes
Default: 5min
size
Size of graph.
Possible values: S, M, L and XL
Optional: Yes
Default: M
offset
Graph offset base.
Possible values: zero, wiggle, expand and value
Optional: Yes
Default: value
events
Every graph must have at least one graph definition for rendering. Events have 2 values called name, and title.
name
This is the name of event, must be given.
title
Title of event, this will be shown in legend and not a mandatory value.
➜ [sudo] pip uninstall simmetrica
➜ rm -rfv /opt/simmetrica
Special thanks to Dougal Matthews for making this project Python 3 compatible.
I just created this project for learning some Python. Please help me to make it better! Don't hesitate to open an issue for asking something or creating a pull request for a new feature. Thanks!
Copyright (c) 2013-2014 Osman Ungur
Permission is hereby granted, free of charge, to any person obtaining a copy of this software and associated documentation files (the "Software"), to deal in the Software without restriction, including without limitation the rights to use, copy, modify, merge, publish, distribute, sublicense, and/or sell copies of the Software, and to permit persons to whom the Software is furnished to do so, subject to the following conditions:
The above copyright notice and this permission notice shall be included in all copies or substantial portions of the Software.
THE SOFTWARE IS PROVIDED "AS IS", WITHOUT WARRANTY OF ANY KIND, EXPRESS OR IMPLIED, INCLUDING BUT NOT LIMITED TO THE WARRANTIES OF MERCHANTABILITY, FITNESS FOR A PARTICULAR PURPOSE AND NONINFRINGEMENT. IN NO EVENT SHALL THE AUTHORS OR COPYRIGHT HOLDERS BE LIABLE FOR ANY CLAIM, DAMAGES OR OTHER LIABILITY, WHETHER IN AN ACTION OF CONTRACT, TORT OR OTHERWISE, ARISING FROM, OUT OF OR IN CONNECTION WITH THE SOFTWARE OR THE USE OR OTHER DEALINGS IN THE SOFTWARE.