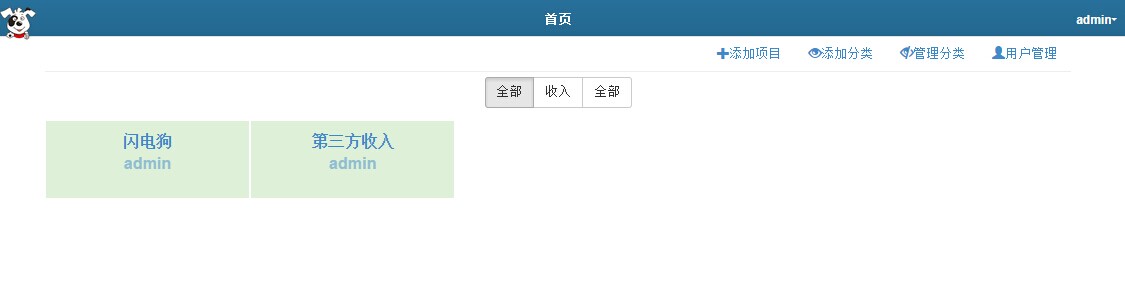
Bolt Monitoring (flash-dog) originated in Hangzhou Sky Network Technology Co., a real project, the main advantage is lightweight, fast, non-invasive, does not affect the business code, just add a few jar log4j package and modify the configuration file, you can monitor any indicators, such as CPU, memory, threads, gaming revenue, the number of online and so on. After the 2012 Open Source in the game, pay, education and many other Internet companies a wide range of applications. Online demo, http://115.28.11.12:8080/flash-dog/ , username: admin, password:123456
- [Installation deployment] (https://github.com/flash-dog/flash-dog/wiki/1%E5%AE%89%E8%A3%85%E9%83%A8%E7%BD%B2)
- [Application access] (https://github.com/flash-dog/flash-dog/wiki/2.%E5%BA%94%E7%94%A8%E6%8E%A5%E5%85% A5)
- [Proxy mode] (https://github.com/flash-dog/flash-dog/wiki/%E4%BB%A3%E7%90%86%E6%A8%A1%E5%BC%8F)
- [Logback Extended] (https://github.com/flash-dog/flash-dog/wiki/%E4%BB%A3%E7%90%86%E6%A8%A1%E5%BC%8F)
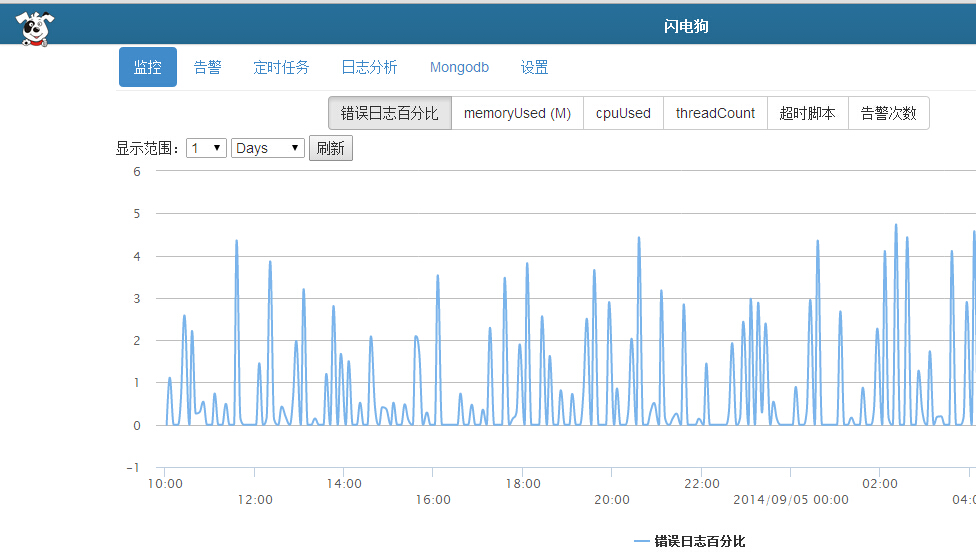
- If you can monitor business Yes, the default is to monitor jvm performance and error logs, which provides a template pace, minor modifications will be able to conduct business operations by analyzing statistics logging and monitoring
- Whether you need to connect business database No, only need to connect mongodb
- What is the warehouse schema mongdob a model of collection and storage mode, there is a fixed size, the space will be reused, such as setting a 1G, data over 1G, the new data will replace the old data, the non-warehouse schema will continue to increase, so the log table, it is strongly recommended Use warehouse schema.
- Why did not see the new items added charts Most of the problems are the database link problem, you can set up inside view of the project and log data link is normal. Follow the naming convention can reduce low-level error
- How to customize the output variable The MDC realized by log4j, MDC internal mechanism used to store information similar map, the corresponding method, MDC.put (key, value); use when configuring PatternLayout:% x {key} to output the corresponding value, such as tracking all logs user requests: java code:
MDC.put ("UUID", userId);

log4j configuration:

log4j.appender.MongoDB.layout.ConversionPattern = {"timestamp": "% d", "level": "% p", "className": "% c", "message": "% m", "pid" : "% V", "ip": "% I", uuid: "% X {UUID}"}

* How to monitor access log tomcat
  1. First configure the tomcat log output to log4j, download tomcat-juli.jar to tomcat / bin, overwriting the original jar, download tomcat-util.jar to tomcat / lib, copy log4mongo-java, flash-dog-api-log4j and mongo-java-driver, log4j.properties to lib
  2. Modify tomcat / conf / server.xml in the access-log section: className = "com.skymobi.tomcat.Log4JAccessLogValve"
  3. Restart tomcat, in logs / catalina.log can see the access log